03. Euclidean Clustering with PCL
Header Text
Euclidean Clustering with PCL
ND312 C1 L3 A02 Euclidiean Clustering With PCL [LB]
Inside
pointProcessor
, the
Clustering
function is located right under the
SegmentPlane
function that you previously were working on.
PCL provides some documentation for using its built in euclidean clustering functions. In particular check out lines 71-82.
Euclidean Clustering Arguments
The euclidean clustering object
ec
takes in a distance tolerance. Any points within that distance will be grouped together. It also has min and max arguments for the number of points to represent as clusters. The idea is: if a cluster is really small, it’s probably just noise and we are not concerned with it. Also a max number of points allows us to better break up very large clusters. If a cluster is very large it might just be that many other clusters are overlapping, and a max tolerance can help us better resolve the object detections. The last argument to the euclidean cluster object is the Kd-Tree. The tree is created and built using the input cloud points, which in this case are going to be the obstacle cloud points.
Back in environment.cpp let's see how to render the different clusters.
std::vector<pcl::PointCloud<pcl::PointXYZ>::Ptr> cloudClusters = pointProcessor->Clustering(segmentCloud.first, 1.0, 3, 30);

int clusterId = 0;
std::vector<Color> colors = {Color(1,0,0), Color(0,1,0), Color(0,0,1)};

for(pcl::PointCloud<pcl::PointXYZ>::Ptr cluster : cloudClusters)
{
      std::cout << "cluster size ";
      pointProcessor->numPoints(cluster);
      renderPointCloud(viewer,cluster,"obstCloud"+std::to_string(clusterId),colors[clusterId]);
      ++clusterId;
}
In the code above, the
Clustering
method is called and then there is a loop to iterate through each cluster and call
renderPointCloud
on each cluster. The renderPointCloud is expecting each pcl viewer point cloud to have a unique identifier, so clusters are counted with
clusterId
and appended to the
obstCloud
string.
To get different colors for each of the clusters, a list of colors is defined. Here we simply use red, blue and green.
As a bonus the number of points for each cluster is logged. This can be a helpful debugging tool later when trying to pick good min and max point values.
In this example the min points for a cluster are set to 3, and the max set to 30. The distance tolerance is also set to 1. Some time and effort will be needed to pick good hyperparameters, but many cases actually there won't be a perfect combination to always get perfect results.
Cluster Results
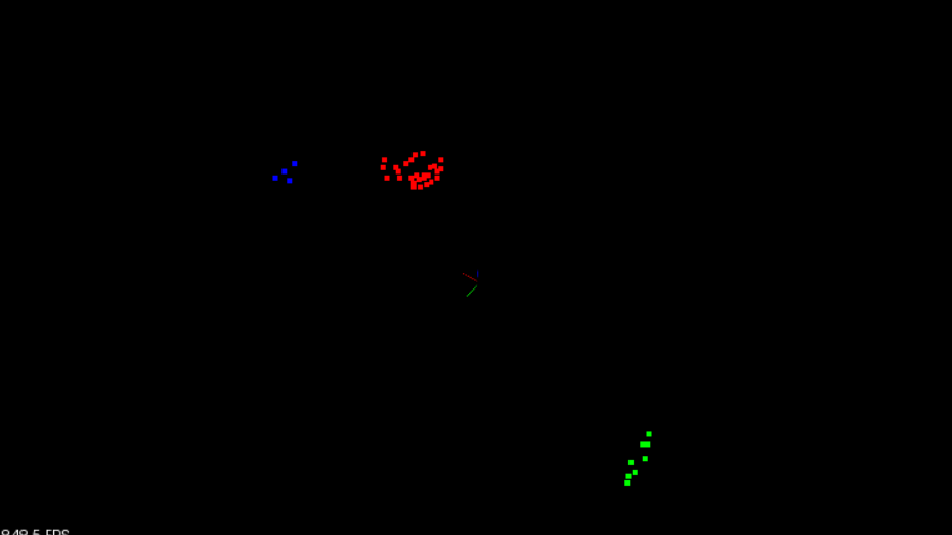
Clusters shown in different colors, red, green, and blue.
Instructions
-
Define the function clusters in
pointProcessorusing the pcl document guide above for reference. - Experiment with different hyperparameters for the clustering algorithm.
-
In
environment.cpprender the different clusters using the code sample above.
Workspace
This section contains either a workspace (it can be a Jupyter Notebook workspace or an online code editor work space, etc.) and it cannot be automatically downloaded to be generated here. Please access the classroom with your account and manually download the workspace to your local machine. Note that for some courses, Udacity upload the workspace files onto https://github.com/udacity , so you may be able to download them there.
Workspace Information:
- Default file path:
- Workspace type: react
- Opened files (when workspace is loaded): n/a
Solution
ND312 C1 L3 A10 Euclidean Clustering With PCL - Solution